DRP - Forecast Method FAQ
Question: What are the different forecast methods used by DRP and what are the forecast method parameters?
Answer: The software supports multiple forecast methods to handle the requirements of different types of products, which may have different patterns of demand history. The current methods and parameters are listed below. New standard (and custom) forecast methods may be developed to handle the requirements of specific situations.
Note The parameter names must be entered exactly as listed for the calculations to work properly. These same parameter names can be used for different forecast methods.
The following forecast method parameters are used for every forecast method:
|
Parameter |
Type |
Default Value |
Description |
|
Available to Promise |
Character |
Standard |
This determines the logic to be used for the available to promise calculation. For more information, see DRP - Available to Promise FAQ.
|
|
Available To Promise Days |
Integer |
0 |
This is the available to promise days. This is used in conjunction with the Available to Promise parameter. For more information, see DRP - Available to Promise FAQ. |
|
Exclude Promotional Sales |
Logical |
No |
Select one of the following options:
|
|
Forecast Direct Ship |
Logical |
No |
Select one of the following options:
|
|
Forecast Frozen Periods |
Integer |
0 |
Select one of the following values for the number of forecast frozen periods (periods for which automatic reforecasting is not changed):
Note Forecasts can still be manually changed for forecast frozen periods. |
|
Forecast Hold |
Character |
Standard |
This determines the logic used for putting sales orders on forecast hold. For more information, see DRP - Forecast Hold FAQ. Select one of the following values:
|
|
Forecast Hold % Overage |
Integer |
0 |
Enter the percentage overage that you will tolerate. If a order line is for a percentage that is greater than this percentage, the order is placed on forecast hold. |
|
Forecast Hold Shipment Quantity |
Character |
Standard |
Select one of the following to determine allocation for orders on forecast hold:
|
|
Forecast Logic |
Character |
Standard |
Select one of the following to configure how the Actual Forecast row is calculated in Product DRP Management:
|
|
Forecast View |
Character |
Standard |
This determines how the Manage Product Forecasts tab in Product DRP Management is displayed. Select one of the following options:
Note This can be overridden for specific users in User Extended Options. |
|
History Data |
Character |
Default |
This determines whether point of sale amounts are used for sales history data. Select one of the following options:
|
|
Promotional Forecast Logic |
Character |
Include |
This determines whether the Promotional Forecast row quantities are included in the Actual Forecast row and the remaining forecast in Product DRP Management. Select one of the following options:
|
|
Remainder Forecast |
Character |
Total |
This determines how the Remaining Sales Forecast row is calculated on the DRP Schedule Management tab in Product DRP Management. Select one of the following:
For an example of using both options, see below. |
|
Time Bucket |
Character |
Month |
This determines the time period columns used for calculations and for display in Product DRP Management. Month, Week, and Day are valid options. Note If you change this to Month or Week, rebuild customer forecasts in Forecast Create. |
|
Time Horizon Forward |
Integer |
6 |
This indicates how many time buckets into the future to forecast. |
|
Example The following table displays the calculation difference based on the Forecast Group option selected.
|
Forecast Methods
|
Forecast Method / Program Name |
Parameter |
Type |
Default Value |
Description |
|
Average |
This method is used for products expected to have a relatively steady sales pattern where there may be some slight seasonality, but no radical seasonality. It uses a pure moving average based on the prior sales history time bucket of calendar days, weeks, or months. |
|||
|
|
Time Horizon Past |
Integer |
6 |
This indicates how many time buckets into the past to use to calculate the average. |
|
Example Monthly Time Bucket, 6 months Time Horizon Forward, and 6 months Time Horizon Past:
|
|
Forecast Method / Program Name |
Parameter |
Type |
Default Value |
Description |
|
Average-RAD Season |
This method is used for products with radical seasonality (for example, snow shovels). It uses the prior year as a starting point, then calculates the average moving forward (instead of moving backwards) and a percentage +/- change to calculate forecast. |
|||
|
|
Time Horizon Past |
Integer |
2 |
This indicates how many time buckets to go forward from the previous year’s starting point to use to calculate the average. |
|
|
RAD Seas-% chg last year |
Decimal |
3% |
|
|
Example Monthly Time Bucket, 3 months Time Horizon Forward, 2 months Time Horizon past, 3% increase from last year:
|
|
Forecast Method / Program Name |
Parameter |
Type |
Default Value |
Description |
|
Custom |
This method is used if you have created a program that contains custom forecast logic. |
|||
|
|
Custom Forecast Logic |
Character |
|
This is the file name of the .p that contains your custom forecast logic. |
|
Note Your custom program must begin with the following: {custom-forecast-tmp.i} DEFINE INPUT PARAMETER iProductKey AS CHAR NO-UNDO. DEFINE INPUT PARAMETER iLocationKey AS CHAR NO-UNDO. DEFINE INPUT-OUTPUT PARAMETER TABLE FOR tmp-forecast. The tmp-forecast table includes the following fields:
The tmp-forecast table includes the following indexes: INDEX iNumIdx IS PRIMARY iNum INDEX dToDate dTo INDEX dFromDate dFrom. |
|
Forecast Method / Program Name |
Parameter |
Type |
Default Value |
Description |
|
ExpSmooth |
This exponential smoothing method weighs the most current sales history heavier than the least current sales history.
|
|||
|
|
Alpha |
Decimal |
0.3 |
This is a smoothing factor that controls the weight of sales history. If you increase the value of the Alpha parameter, you increase the affect of the current month's sales history on the calculated forecast. For more information on how this parameter affects forecast calculations, see the example below. |
|
|
Time Horizon Forward |
Integer |
1 |
This indicates how many time buckets into the future to forecast. |
|
|
Time Horizon Past |
Integer |
12 |
This indicates how many time buckets into the past to use for the calculations. |
 This forecast method should not be used for radically seasonal products because it will result in invalid forecasts.
|
Example Non-seasonal product. Monthly Time Bucket, 1 month Time Horizon Forward, 12 months Time Horizon past, 0.3 alpha factor for a non-seasonal product. The basic formula to calculate each month’s new exponential average for a non-seasonal product is: New Average = [Prior Month’s Average x (1.0 - Alpha factor)] + [Current Month’s Actual Sales x Alpha Factor] Using the below table for April: April Exponential Average = [33.0 x ([1.0 - .3]) + [42 x .3] April Exponential Average = 23.1 + 12.6 April Exponential Average = 35.7 Note The Forecast is the Exponential Average derived for the previous month.
|
|
Example Seasonal product. Monthly Time Bucket, 1 month Time Horizon Forward, 12 months Time Horizon past, 0.3 alpha factor for a mildly seasonal product. The advanced formula to calculate each month’s new exponential average and forecast for a mildly seasonal product is slightly different: New Average = [Prior Month’s Average x (1.0 - Alpha factor)] + [(Current Month’s Actual Sales / Seasonal Index) x Alpha Factor] Using the below table for April: April Exponential Average = [157.5 x ([1.0 - .3]) + [(103/.8) x .3] April Exponential Average = 110.3 + 38.6 April Exponential Average = 148.9 Note The Forecast is the Exponential Average derived for the previous month x the Seasonal Index for the current month. April Forecast = 157.5 (March Exponential Average) x 0.80 (April Seasonal Index) April Forecast = 148.9
|
|
Forecast Method / Program Name |
Parameter |
Type |
Default Value |
Description |
|
MildSeasonalAvg |
This forecast method uses a seasonal index along with a moving average. The moving average first is de-seasonalized (either period by period, or by a group of periods), then re-seasonalized for the forecast periods. This moving average detects whether there is stronger or slower demand for each season.
|
|||
|
|
Group by Deseasonalization |
Logical |
No |
Select one of the following options:
|
|
|
Periods to Deseasonalize |
Integer |
4 |
This is the number of periods to group together if you enter Yes for the Group by Deseasonalization parameter. |
|
|
Time Horizon Past |
Integer |
12 |
This indicates how many time buckets into the past to use for the calculations. |
|
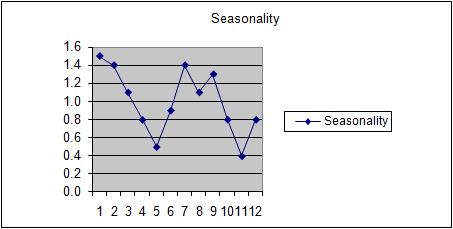
Example Product A has the following seasonality:
The following table is an example of forecasting the mild seasonal moving average of product A with every month deseasonalized.
In this case, net sales for January-September 2020 equals 10,100, and forecasted sales for January-September 2021 equals 10,230. The following table is an example of forecasting the mild seasonal moving average of product A with every four-month group deseasonalized.
In this case, net sales for January-September 2020 equals 10,100. The following table compares the two deseasonalization methods:
|
|
Forecast Method / Program Name |
Parameter |
Type |
Default Value |
Description |
|
RAD Season |
This method is used for products with radical seasonality (for example, snow shovels). It uses the prior year actual results and a percentage +/- change to calculate this year’s forecast.
|
|||
|
|
RAD Seas-% chg last year |
Decimal |
-.10 |
This is the radical seasonality percentage change compared to the actual prior year's sales. |
|
Example Monthly Time Bucket, 3 months Time Horizon Forward, and 3% increase from last year:
|
|
Example Monthly Time Bucket, 6 months Time Horizon Forward, and -10% change from last year:
|
|
Forecast Method / Program Name |
Parameter |
Type |
Default Value |
Description |
|
Weighted Average |
This method is used for products for which future order demand and previous sales cannot be directly correlated. It uses a weighted moving average based on the prior sales history and/or prior order history across two separate time buckets of calendar days, weeks, or months. |
|||
|
|
Order History Date |
Character |
Order |
This is the type of date used for order history (either Order or Required). |
|
|
Time Horizon Order History 1 |
Integer |
6 |
This is the first number of past time buckets (based on the value of the Time Bucket parameter) to use for order history. |
|
|
Time Horizon Order History 2 |
Integer |
2 |
This is the second number of past time buckets (based on the value of the Time Bucket parameter) to use for order history. |
|
|
Time Horizon Order History Weight 1 |
Decimal |
.25 |
This is the weight of the order history for the first range of history. The sum of the Time Horizon Order History Weight 1, Time Horizon Order History Weight 2, Time Horizon Sales History Weight 1, and Time Horizon Sales History Weight 2 parameters must equal 1. |
|
|
Time Horizon Order History Weight 2 |
Decimal |
.25 |
This is the weight of the order history for the second range of history. The sum of the Time Horizon Order History Weight 1, Time Horizon Order History Weight 2, Time Horizon Sales History Weight 1, and Time Horizon Sales History Weight 2 parameters must equal 1. |
|
|
Time Horizon Past |
Integer |
6 |
This parameter is not used for this forecast method. |
|
|
Time Horizon Sales History 1 |
Integer |
6 |
This is the first number of past time buckets (based on the value of the Time Bucket parameter) to use for sales history. |
|
|
Time Horizon Sales History 2 |
Integer |
2 |
This is the second number of past time buckets (based on the value of the Time Bucket parameter) to use for order history. |
|
|
Time Horizon Sales History Weight 1 |
Decimal |
.25 |
This is the weight of the sales history for the first range of history. The sum of the Time Horizon Order History Weight 1, Time Horizon Order History Weight 2, Time Horizon Sales History Weight 1, and Time Horizon Sales History Weight 2 parameters must equal 1. |
|
|
Time Horizon Sales History Weight 2 |
Decimal |
.25 |
This is the weight of the sales history for the second range of history. The sum of the Time Horizon Order History Weight 1, Time Horizon Order History Weight 2, Time Horizon Sales History Weight 1, and Time Horizon Sales History Weight 2 parameters must equal 1. |
|
Example The following table illustrates a typical forecast calculation:
|
|
Forecast Method / Program Name |
Parameter |
Type |
Default Value |
Description |
|
Yr over Yr Seasonality |
This forecast method calculates a seasonal year to year rate of change (growth or decline), which is used for forecast calculations. NOTE You must use monthly time buckets for this forecast method. |
|||
|
|
# of Months - Max Forecast |
Integer |
0 |
This is the number of months to go back from the current month to search for the highest adjusted net sales. EXAMPLE If the current month is February 2020 and this is set to 12, the system will seek the highest sales from February 2019 to January 2020. The forecast going forward cannot exceed this value. If 0 is entered, this logic is ignored. |
|
|
# of Months - Change Factor |
Integer |
0 |
This is the number of months to go back from the current month. This is used for the change factor calculation. EXAMPLE If this value is 4, and the current month is February 2020, then it will add the four months preceding (October 2019, November 2019, December 2019, and January 2020 = 150) and this will be the numerator, and then add the same four preceding months from a year ago (October 2018, November 2018, December 2018 and Jan 2019 = 100) and this will be the denominator. So, the change factor will be 1.5. |
|
|
Change Factor Option |
Character |
Current Month |
Select one of the following options:
|
|
|
Time Horizon Past |
Integer |
24 |
This indicates how many time buckets into the past to use for the calculations. |
|
Example The following tables illustrate typical forecast calculations.
|