Main Menu
The Apprise Main Menu window is a centralized location for you to access all your company's data and the Apprise programs that enable you to perform your work.
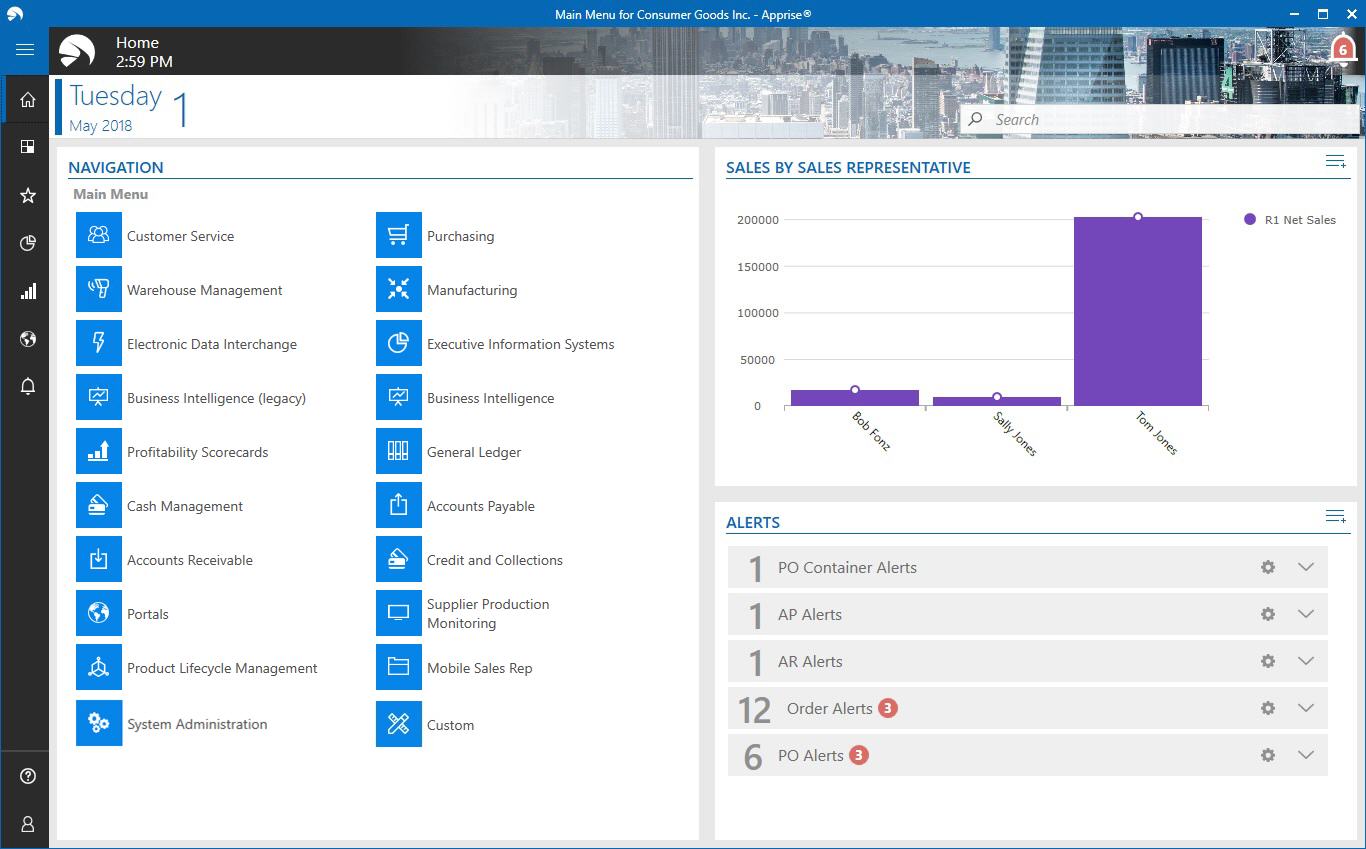
The top of the window displays the date/time, and the Quick Launch field.

This field allows you to quickly access Apprise programs, or search for the following data:
-
sales orders
-
purchase orders
-
work orders
-
invoices
-
product codes
-
supplier codes
-
customer codes
EXAMPLE If sales order number NJ000000001 exists, you can type NJ000000001 (or NJ.1) in the Quick Launch field to quickly display order information for sales order NJ000000001 in Order Edit.
If you type a number that is valid for multiple records, such as a number that is a sales order number, purchase order number, and invoice number, a selection menu appears, so you can select the appropriate record.
For information on using the Quick Launch field to access Apprise programs, see Navigating Menu Options.
Use the icons at the left of the window to change the display, as follows:
-
Home - View your personalized Home screen.
-
Navigation - View the Apprise menus.
-
Favorites - View your favorite Apprise programs and favorite recordings.
-
Dashboards - View graphs and charts of your company's data. For information on adding dashboards and gauges, see Recording Dashboards.
-
Key Performance Indicators - View grids and charts of key performance indicator data.
-
Web Explorer - View Web pages so you can view important information. Web browser navigation buttons allow you to navigate back and forward between Web pages, refresh a displayed page, display a page you have set up as a home page, set a displayed page as a home page, and enter a URL of a specific page you want to display.
-
Alerts - View a customizable list of system and task alerts that inform you about activity.
-
Help - View the Apprise Help.
-
Settings - Customize your settings, including the Home screen.
NOTE You can use the  button to display the above labels for each icon.
The Home screen can be divided into four panels (top-left, bottom-left, top-right, and bottom-right) that display any of the following:
-
Menu Navigation - A hierarchical menu that allows you to access available Apprise programs.
-
Menu Favorites - Links for your favorite Apprise programs.
-
Action Center - A customizable list of action items.
-
Key Performance Indicators - A grid or chart of key performance indicator data.
-
Alerts - A customizable list of system and task alerts that inform you about activity.
-
Recording Favorites - Links for your favorite recordings.
-
Dashboard - A graph or chart of your company's data, or an illustration of your company's data, represented as a mechanical gauge.
If you need more space for any of these items, you can use two panels (both the left panels or both the right panels) for the same item. For example, you can display the Menu Navigation in both the top-left and bottom-left panel.
Alerts are refreshed and note reminders are sent periodically (every 12 minutes if your session is idle). A status dialog box may appear when sending note reminders. For more information on note reminders, see Notes Entry.
Customizing the Home Screen
You can click the Settings button to customize the four panels of the Home screen.
For information on adding panels, see the following sections.
Menu Navigation
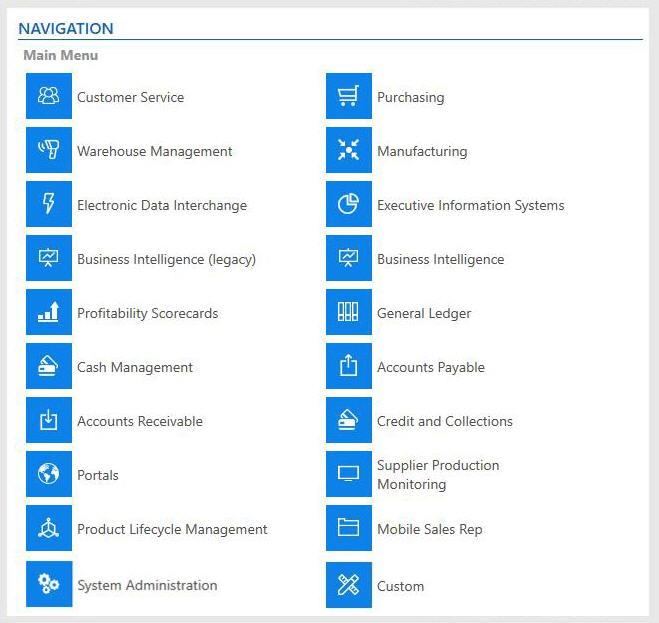
Menu Navigation panels display the modules and programs you have permission to access. Modules and programs display with a small icon representing the module or program. Each module includes multiple programs and may include submenus.
To display the programs and submenus within a module in a Menu Navigation panel, click the module. You can then click a submenu to display the programs within it. Click a program name in a Menu Navigation panel to display the window associated with it.
You can use the breadcrumb trail at the top of the Menu Navigation panel to return to a module or submenu.
Menu Favorites
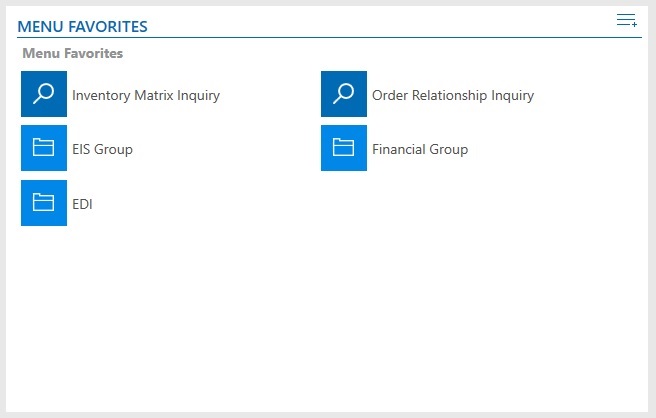
Menu Favorites panels display a list of programs that you have set up as favorites. These typically are programs that you use most frequently, and want to be able to access quickly.
To set up a program as a favorite, drag it from a Menu Navigation panel or right-click it in a Menu Navigation panel, and select Pin to Favorites.
Click a favorite to display the program window associated with it.
You can drag a favorite to move it within the Menu Favorites panel.
To create a submenu of favorites, click the ![]() button in the Menu Favorites panel, select Add Group, and enter a name for the submenu. You can then drag favorites into the submenu. You can also right-click a program in a Menu Navigation panel, and select Pin to Favorite Group, then select a group into which to add the favorite.
button in the Menu Favorites panel, select Add Group, and enter a name for the submenu. You can then drag favorites into the submenu. You can also right-click a program in a Menu Navigation panel, and select Pin to Favorite Group, then select a group into which to add the favorite.
To rename a submenu of favorites, click the ![]() button in the Menu Favorites panel, select Edit Favorites, and click the Rename Group button. You can then type a new name for the submenu of favorites.
button in the Menu Favorites panel, select Edit Favorites, and click the Rename Group button. You can then type a new name for the submenu of favorites.
To delete a favorite (or submenu of favorites), click the ![]() button in the Menu Favorites panel, select Edit Favorites, and click the Unpin from Favorites button for the favorite (or submenu of favorites). When you are finished deleting favorites, click the
button in the Menu Favorites panel, select Edit Favorites, and click the Unpin from Favorites button for the favorite (or submenu of favorites). When you are finished deleting favorites, click the ![]() button in the Menu Favorites panel, and select Close Edit Mode.
button in the Menu Favorites panel, and select Close Edit Mode.
Action Center
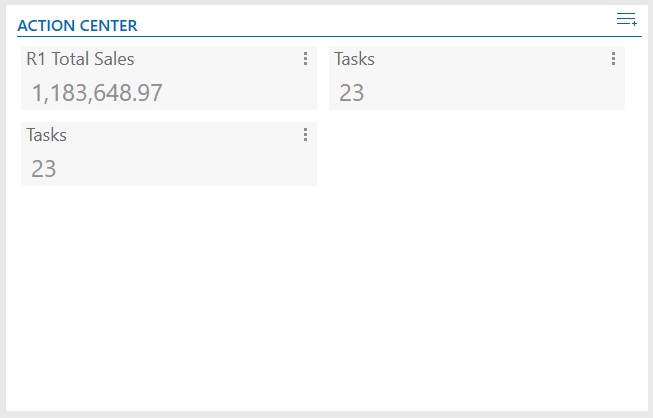
The Action Center provides detailed information about the tasks you need to perform, such as the number of payments that are past due or the number of orders that are on hold. It allows you to log in, and immediately perform work for key action items.
To set up an action item:
-
Click the
 button in the Action Center panel.
 -
Select Record Action Item.
-
Navigate to a field that contains the data you want to display in the action item. If you need to enter dates to navigate to the field, use virtual dates for the dates.
-
Right-click the field, and select Create Action Item.
Click an action item to view the field associated with the action item.
To delete an action item, click the  button in the top-right corner of the action item, and select Delete.
To change the title of an action item, click the button in the top-right corner of the action item, select Rename, and enter the new title.
To refresh data for an action item, click the button in the top-right corner of the action item, and select Refresh. To refresh data for all action items, click the ![]() button in the Action Center panel, and select Refresh Action Items.
button in the Action Center panel, and select Refresh Action Items.
You can drag an action item to move it within the Action Center panel.
Key Performance Indicators

Key Performance Indicators (KPI) panels display key performance information for your company in a grid or chart. Each KPI panel can have multiple KPIs (rows). For information on setting up KPIs, see Key Performance Indicator Wizard.
To refresh the data for a KPI, click the ![]() button in the Key Performance Indicators panel, and select Refresh KPI.
button in the Key Performance Indicators panel, and select Refresh KPI.
To delete a KPI, click the ![]() button in the Key Performance Indicators panel, and select Delete KPI.
button in the Key Performance Indicators panel, and select Delete KPI.
To change the title of a KPI, click the ![]() button in the Key Performance Indicators panel, select Change KPI Title, and enter the new title.
button in the Key Performance Indicators panel, select Change KPI Title, and enter the new title.
To edit a KPI panel, click the ![]() button in the Key Performance Indicators panel, and select Add/Remove KPI.
button in the Key Performance Indicators panel, and select Add/Remove KPI.
To change the display of a KPI panel from a grid to a chart, click the ![]() button in the Key Performance Indicators panel, select Chart Style, and select a chart style. You can then use the same technique to change the display back to a grid.
button in the Key Performance Indicators panel, select Chart Style, and select a chart style. You can then use the same technique to change the display back to a grid.
Alerts
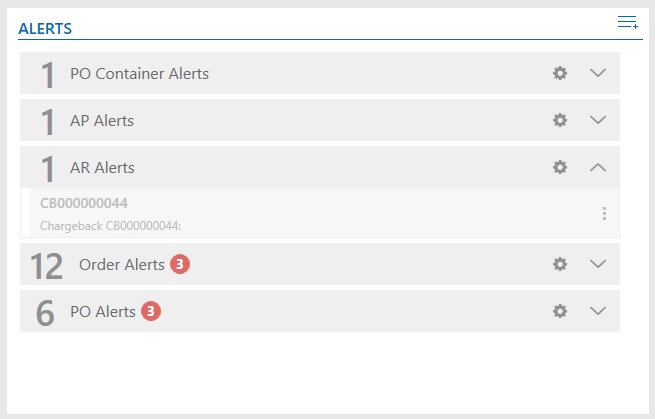
Alerts panels display system alerts and task alerts for tasks assigned for the Product Lifecycle Management and Supplier Production Monitoring modules. This display includes the latest 100 alerts arranged in the reverse chronological order, that is, the most recent alert appears first followed by the older alerts. You can set up conditions to trigger system alerts in Alert Wizard.
NOTE The number of unread alerts appears in the top-right of the Main Menu window in a bell icon. You can click the icon to display alerts.
Alerts are grouped into alert categories. The number of unread alerts in each category displays in a red circle. You can click the down arrow to view alerts within each category. Click a system alert to display Alert Viewer, which allows you to view and update alerts.
For the Product Lifecycle Management and Supplier Production Monitoring modules, the following types of alerts may appear in an Alerts panel:
-
Assigned tasks - One or more tasks are assigned to you.
-
Informational - A task has changed.
Note You can double-click an alert for assigned supplier production monitoring or product lifecycle management tasks to display Monitoring Data Entry Management or Lifecycle Data Entry Management, both of which allow you to manage assigned tasks.
If you click a supplier production monitoring or product lifecycle management informational alert, the corresponding workflow alert is marked as reviewed. If you delete an informational alert, the corresponding workflow alert is marked as closed.
Unread alerts appear in a bold font. To mark an alert as read, click the button, and select Mark as Read. To mark it as unread again, click the button, and select Mark as Unread.
To delete an alert, click the button, and select Delete.
To change the color of an alert, click the button, select Color, and then select the color. To remove the color, click the button again, select Color, and select Default.
To mark all alerts in an alert category as read, click the  button, and select Mark All as Read.
To mark all alerts in an alert category as unread, click the button, and select Mark All as Un-read.
To delete all alerts in an alert category, click the button, and select Delete All.
To display alerts in all alert categories, click the ![]() button in the Alerts panel, and select Expand All.
button in the Alerts panel, and select Expand All.
To hide alerts in all alert categories, click the ![]() button in the Alerts panel, and select Collapse All.
button in the Alerts panel, and select Collapse All.
To mark alerts in all alert categories as read, click the ![]() button in the Alerts panel, and select Mark All as Read.
button in the Alerts panel, and select Mark All as Read.
To mark alerts in all alert categories as unread, click the ![]() button in the Alerts panel, and select Mark All as Un-read.
button in the Alerts panel, and select Mark All as Un-read.
To delete read alerts in all alert categories, click the ![]() button in the Alerts panel, and select Delete All Read Alerts.
button in the Alerts panel, and select Delete All Read Alerts.
To display Alert Wizard, click the ![]() button in the Alerts panel, and select Open Alert Wizard.
button in the Alerts panel, and select Open Alert Wizard.
Recording Favorites
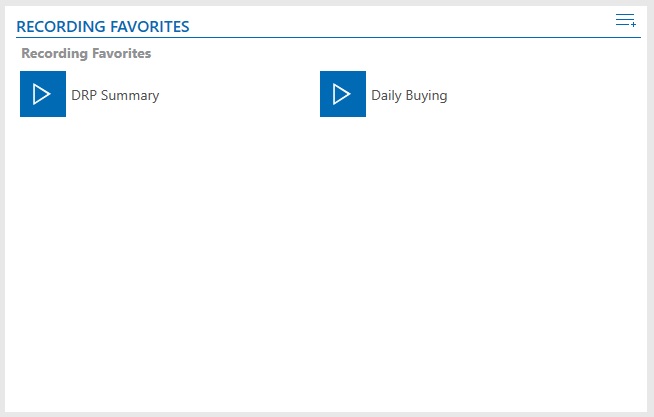
Recording Favorites panels display a list of recordings that you have set up as favorites. These typically are recordings that you use most frequently, and want to be able to access quickly.
To set up a recording as a favorite, edit it in Recorder Manager, and select the Favorite Recording check box.
Click a recording favorite to perform the tasks associated with the recording.
To delete a recording favorite, click the ![]() button in the Recording Favorites panel, select Edit Favorites, and click the Unpin from Favorites button for the favorite. When you are finished deleting recording favorites, click the
button in the Recording Favorites panel, select Edit Favorites, and click the Unpin from Favorites button for the favorite. When you are finished deleting recording favorites, click the ![]() button in the Recording Favorites panel, and select Close Edit Mode.
button in the Recording Favorites panel, and select Close Edit Mode.
Dashboards
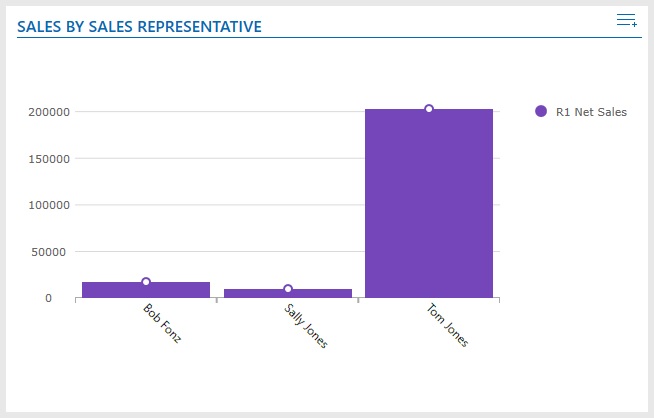
Dashboards display charts and graphs of system data. For information on creating and using dashboards, see Recording Dashboards.
Point to a charted amount to display the amount.
To refresh data in a dashboard, click the ![]() button in the Dashboard panel, and select Refresh Dashboard.
button in the Dashboard panel, and select Refresh Dashboard.
To delete a dashboard, click the ![]() button in the Dashboard panel in the, and select Delete Dashboard.
button in the Dashboard panel in the, and select Delete Dashboard.
To change the title of a dashboard, click the ![]() button in the Dashboard panel, select Change Dashboard Title, and enter the new title.
button in the Dashboard panel, select Change Dashboard Title, and enter the new title.
To view the data that the dashboard is charting, double-click the dashboard, or click the ![]() button in the Dashboard panel, and select View Detail.
button in the Dashboard panel, and select View Detail.
To export the chart to an image file, click the ![]() button in the Dashboard panel, and select Export As Image, enter a file name and location for the image, select the image file type (.bmp, .jpg, or png), and click the Save button.
button in the Dashboard panel, and select Export As Image, enter a file name and location for the image, select the image file type (.bmp, .jpg, or png), and click the Save button.
To change the chart style (pie, column, etc.) of a dashboard, click the ![]() button in the Dashboard panel, select Chart Style, and select the desired style.
button in the Dashboard panel, select Chart Style, and select the desired style.
Gauges

Gauges are dashboards that display system data in a mechanical gauge format. For information on creating and using gauges, see Recording Dashboards.
To refresh data in a gauge,click the ![]() button in the Dashboard panel, and select Refresh Gauge.
button in the Dashboard panel, and select Refresh Gauge.
To delete a gauge, click the ![]() button in the Dashboard panel, and select Delete Gauge.
button in the Dashboard panel, and select Delete Gauge.
To change the title of a gauge, click the ![]() button in the Dashboard panel, select Change Dashboard Title, and enter the new title.
button in the Dashboard panel, select Change Dashboard Title, and enter the new title.
To view the data that the gauge is measuring, click the ![]() button in the Dashboard panel, and select View Detail.
button in the Dashboard panel, and select View Detail.